Video Super-Resolution Project
|
1Chih-Chun Hsu, 1Chia-Wen Lin, and Li-Wei Kang |
1Department of Electrical Engineering National Tsing Hua University Hsinchu 30013, Taiwan |
to investigate the impact of DTS models on SR performance, we also implement two
state-of-the-art nonlinear DTS models, High-order DTS (HO-DTS) [23] and
high-order-SVD-DTS (HOSVD-DTS) [34], to replace the linear model in (8) used in
the proposed DTS-SR. Fig. 10 illustrates three reconstructed SR frames for Video
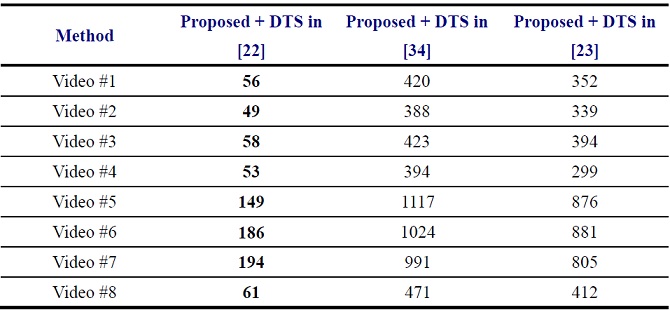
#2 using linear DTS method [22], HO-DTS, and HOSVD-DTS. The complexities of the
DTS methods in [23], [34] are significantly higher than that of the linear model
in [22], whereas the visual qualities of the reconstructed HR videos using these
three DTS
.
All test videos and super-resolved video using three different DTS methods in [22], [23], and [34] can be downloaded from here.
Video #1: (a) The ground truth frame and the reconstructed SR frames using (b) the linear model in [22], (c) HO-DTS model in [23], and (d) HOSVD-DTS in [34]. The visual quality of these methods are quite similar. In conclusion, we adopt the linear model in [22] to save the computational time.
Table 1:
Subjective “visual quality” evaluation by paired comparisons (in relative
winning percentage) for
reconstructed
HR video
#1
obtained using the proposed method with various DTS models in [22], [23], and
[34].
|
Method |
Proposed + DTS in [22] |
Proposed + DTS in [34] |
Proposed + DTS in [23] |
Average |
|
Proposed + DTS in [22] |
- |
48% |
53% |
50.5% |
|
Proposed + DTS in [34] |
52% |
- |
53% |
52.5% |
|
Proposed + DTS in [23] |
47% |
47% |
- |
47.0% |
Video #2: (a) The ground truth frame and the reconstructed SR frames using (b) the linear model in [22], (c) HO-DTS model in [23], and (d) HOSVD-DTS in [34]. The visual quality of these methods are quite similar. In conclusion, we adopt the linear model in [22] to save the computational time.
Table 2: Subjective “visual quality” evaluation by paired comparisons (in relative winning percentage) for the reconstructed HR video #2
|
Method |
Proposed + DTS in [22] |
Proposed + DTS in [34] |
Proposed + DTS in [23] |
Average |
|
Proposed + DTS in [22] |
- |
49% |
52% |
50.5% |
|
Proposed + DTS in [34] |
51% |
- |
53% |
52.0% |
|
Proposed + DTS in [23] |
48% |
47% |
- |
47.5% |
Video #3: (a) The ground truth frame and the reconstructed SR frames using (b) the linear model in [22], (c) HO-DTS model in [23], and (d) HOSVD-DTS in [34]. The visual quality of these methods are quite similar. In conclusion, we adopt the linear model in [22] to save the computational time.
Table 3: Subjective “visual quality” evaluation by paired comparisons (in relative winning percentage) for the reconstructed HR video #3
|
Method |
Proposed + DTS in [22] |
Proposed + DTS in [34] |
Proposed + DTS in [23] |
Average |
|
Proposed + DTS in [22] |
- |
50% |
50% |
50.0% |
|
Proposed + DTS in [34] |
50% |
- |
51% |
50.5% |
|
Proposed + DTS in [23] |
50% |
49% |
- |
49.5% |
Video #4: (a) The ground truth frame and the reconstructed SR frames using (b) the linear model in [22], (c) HO-DTS model in [23], and (d) HOSVD-DTS in [34]. The visual quality of these methods are quite similar. In conclusion, we adopt the linear model in [22] to save the computational time.
Table 4: Subjective “visual quality” evaluation by paired comparisons (in relative winning percentage) for the reconstructed HR video #4
|
Method |
Proposed + DTS in [22] |
Proposed + DTS in [34] |
Proposed + DTS in [23] |
Average |
|
Proposed + DTS in [22] |
- |
45% |
52% |
48.5% |
|
Proposed + DTS in [34] |
55% |
- |
51% |
53.0% |
|
Proposed + DTS in [23] |
48% |
49% |
- |
48.5% |
Video #5: (a) The ground truth frame and the reconstructed SR frames using (b) the linear model in [22], (c) HO-DTS model in [23], and (d) HOSVD-DTS in [34]. The visual quality of these methods are quite similar. In conclusion, we adopt the linear model in [22] to save the computational time.
Table 5: Subjective “visual quality” evaluation by paired comparisons (in relative winning percentage) for the reconstructed HR video #5
|
Method |
Proposed + DTS in [22] |
Proposed + DTS in [34] |
Proposed + DTS in [23] |
Average |
|
Proposed + DTS in [22] |
- |
52% |
51% |
51.5% |
|
Proposed + DTS in [34] |
48% |
- |
52% |
50.0% |
|
Proposed + DTS in [23] |
49% |
48% |
- |
48.5% |
Video #6: (a) The ground truth frame and the reconstructed SR frames using (b) the linear model in [22], (c) HO-DTS model in [23], and (d) HOSVD-DTS in [34]. The visual quality of these methods are quite similar. In conclusion, we adopt the linear model in [22] to save the computational time.
Table 6: Subjective “visual quality” evaluation by paired comparisons (in relative winning percentage) for the reconstructed HR video #6
|
Method |
Proposed + DTS in [22] |
Proposed + DTS in [34] |
Proposed + DTS in [23] |
Average |
|
Proposed + DTS in [22] |
- |
53% |
50% |
51.5% |
|
Proposed + DTS in [34] |
47% |
- |
52% |
49.5% |
|
Proposed + DTS in [23] |
50% |
48% |
- |
49.0% |
Video #7: (a) The ground truth frame and the reconstructed SR frames using (b) the linear model in [22], (c) HO-DTS model in [23], and (d) HOSVD-DTS in [34]. The visual quality of these methods are quite similar. In conclusion, we adopt the linear model in [22] to save the computational time.
Table 7: Subjective “visual quality” evaluation by paired comparisons (in relative winning percentage) for the reconstructed HR video #7
|
Method |
Proposed + DTS in [22] |
Proposed + DTS in [34] |
Proposed + DTS in [23] |
Average |
|
Proposed + DTS in [22] |
- |
51% |
49% |
50.0% |
|
Proposed + DTS in [34] |
49% |
- |
51% |
50.0% |
|
Proposed + DTS in [23] |
51% |
49% |
- |
50.0% |
Video #8: (a) The ground truth frame and the reconstructed SR frames using (b) the linear model in [22], (c) HO-DTS model in [23], and (d) HOSVD-DTS in [34]. The visual quality of these methods are quite similar. In conclusion, we adopt the linear model in [22] to save the computational time.
Table 7: Subjective “visual quality” evaluation by paired comparisons (in relative winning percentage) for the reconstructed HR video #7
|
Method |
Proposed + DTS in [22] |
Proposed + DTS in [34] |
Proposed + DTS in [23] |
Average |
|
Proposed + DTS in [22] |
- |
51% |
50% |
50.5% |
|
Proposed + DTS in [34] |
49% |
- |
51% |
50.0% |
|
Proposed + DTS in [23] |
50% |
49% |
- |
49.5% |
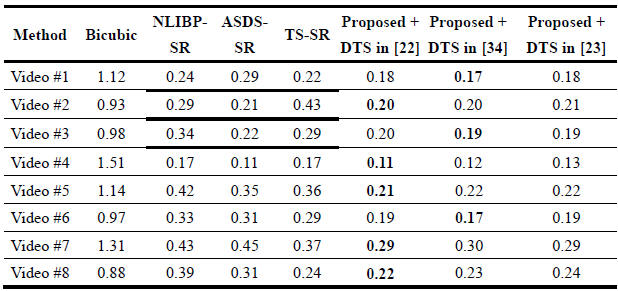
Table 1: Objective Evaluation by THE MOVIE Index for the Reconstructed SR Videos Obtained Using the Bicubic [3], NLIBP-SR, [6] ASDS-SR [11], TS-SR [26],, the proposed method, the proposed method with HOSVD-DTS [34], and the proposed method with DTS in [23] (Smaller MOVIE Value Indicates Higher Visual Quality).
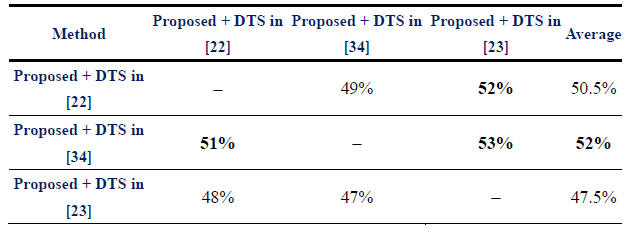
Table 2:
Objective
“visual quality” evaluation by paired comparisons (in relative winning
percentage) for the eight reconstructed HR videos obtained using the
proposed method with the linear DTS methods in [22], .[23], and [34].
References
[6]
W. Dong, L. Zhang, G. Shi, and X. Wu, “Nonlocal back-projection for adaptive
image enlargement,” in Proc. IEEE Int. Conf.
Image Process.,
Cairo, Egypt,
Nov. 2009, pp. 349−352.
[9]
J. Yang, J. Wright, T. Huang, and Y. Ma, “Image super-resolution via sparse
representation,” IEEE Trans. Image
Process., vol. 19,
no. 11, pp. 2861–2873,
Nov. 2010.
[11]
W. Dong, L. Zhang, G. Shi, and X. Wu, “Image deblurring and super-resolution by
adaptive sparse domain selection and adaptive regularization,”
IEEE Trans. Image Process., vol. 20,
no. 7, pp. 1838−1857,
July 2011.
[22]
G.
Doretto, A.
Chiuso, Y.
N.
Wu,
and S.
Soatto,
“Dynamic
textures,”
Int.
J.
Comput. Vis.,
vol. 51,
no. 2,
pp. 91−109,
2003.
[23]
M.
Hyndman, A.
D. Jepson,
and
D.
J. Fleet,
“Higher-order
autoregressive
models
for
dynamic
textures,”
in Proc.
British Machine
Vis.
Conf.,
Warwick, Sept.
2007,
pp.
1−10.
[26]
Y. HaCohen, R. Fattal, and D. Lischinski, “Image upsampling via texture
hallucination,” in Proc.
IEEE Int.
Conf.
Comput. Photography,
Cambridge,
MA,
USA, pp. 20−30,
Mar.
2010.
[32]
J.-S. Lee, “On designing paired comparison experiments for subjective
multimedia quality assessment,” IEEE
Trans. Multimedia, vol. 16, no. 2, pp. 564–571, Feb. 2014.
[34] G. Zhao, and P. Matti, “Local binary pattern descriptors for dynamic
texture recognition,” in Proc. of 18th EEEE International Conference on
Pattern Recognition (ICPR). Vol. 2. 2006.