Self-Learning-Based
Joint Super-Resolution and Deblocking for a Highly Compressed Image
-Experiments
Analysis and Discussion
|
In this page, we
analyze our experiments to summarize the effectiveness and weakness of our
method as follows:
|
Experiments Analysis
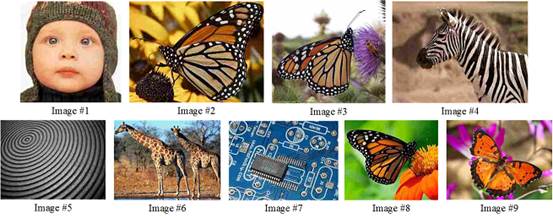
Fig.
1. Our test image dataset.
Table
1 Subjective preference votes (ratios) of the proposed SelfSR method compared to
the other three methods: SelfSR, Cascade I (BM3D+SelfSR), and Cascade II (SelfSR+BM3D)
for individual test images
|
|
SelfSR |
Cascade I |
Cascade II |
Average |
|
Image #1 |
19 (95%) |
19 (95%) |
18 (90%) |
93.3% |
|
Image #2 |
19 (95%) |
16 (80%) |
18 (90%) |
88.4% |
|
Image #3 |
20 (100%) |
16 (80%) |
17 (85%) |
88.3% |
|
Image #4 |
18 (90%) |
14 (70%) |
16 (80%) |
80.0% |
|
Image #5 |
18 (90%) |
14 (70%) |
16 (80%) |
80.0% |
|
Image #6 |
19 (95%) |
18 (90%) |
16 (80%) |
88.3% |
|
Image #7 |
17 (85%) |
16 (80%) |
17 (85%) |
83.3% |
|
Image #8 |
20 (100%) |
14 (70%) |
15 (75%) |
81.7% |
|
Image #9 |
18 (90%) |
19 (95%) |
13 (65%) |
83.3% |
|
Average |
93% |
81% |
81% |
85.2% |
Table
2 Subjective preference votes (ratios) of the proposed SCSR method compared to
the other three methods: SCSR, Cascade I (BM3D+SCSR), and Cascade II (SCSR+BM3D)
for individual test images
|
|
SelfSR |
Cascade I |
Cascade II |
Average |
|
Image #1 |
19 (95%) |
14 (70%) |
18 (90%) |
85.0% |
|
Image #2 |
19 (95%) |
13 (65%) |
19 (95%) |
85.0% |
|
Image #3 |
20 (100%) |
14 (70%) |
20 (100%) |
90.0% |
|
Image #4 |
19 (95%) |
10 (50%) |
17 (85%) |
76.7% |
|
Image #5 |
18 (90%) |
12 (60%) |
14 (70%) |
73.3% |
|
Image #6 |
18 (90%) |
14 (70%) |
17 (85%) |
81.7% |
|
Image #7 |
18 (90%) |
13 (65%) |
19 (95%) |
83.3% |
|
Image #8 |
19 (95%) |
18 (90%) |
12 (60%) |
81.7% |
|
Image #9 |
20 (100%) |
19 (95%) |
12 (60%) |
85.0% |
|
Average |
94% |
71% |
82% |
82.4% |
In the subjective paired
comparison, the ratio between the preference vote for one method and that for
another method is used to compare the performances between the two methods. For
example, if one method is preferred 80% of the time, the SR versions of all 9 test
images obtained by this method receive 80% of the preference vote, indicating
that the method is visually preferred to the compared method in general.
To further analyze our method, we
list in Table 1 and 2 the subjective preference votes (and the corresponding ratios
in the parentheses) of the proposed method compared to the other three methods
for individual test images (see Fig. 1). Note, for each test image, the SR
results of two methods are pairwisely compared 20 times by 20 subjects. The
highest average preference vote (ratios) between our method and compared methods
is highlighted in bold-red, whereas the lowest preference vote is highlighted
in bold-black. It is remarkable that the test image with the lowest average
preference ratios (80% and 73.3%) for the two proposed methods is image #5. On
the other hand, the test images with highest ratios (93.3% and 90%) are image
#1 and image #3, respectively.
Table
3 Attributes of Individual Test Images
|
|
Strong Edges |
Weak Edges |
Textures |
Smooth Regions |
|
Image #1 |
|
|
V |
V |
|
Image #2 |
V |
|
V |
V |
|
Image #3 |
V |
|
V |
V |
|
Image #4 |
V |
V |
V |
V |
|
Image #5 |
|
V |
|
|
|
Image #6 |
V |
|
|
V |
|
Image #7 |
V |
V |
|
|
|
Image #8 |
V |
|
V |
V |
|
Image #9 |
V |
|
V |
V |
|
84.8% |
81.1% |
85.8% |
86.2% |
|
|
Average preference ratio (Proposed SCSR) |
83.3% |
77.8% |
83.9% |
83.6% |
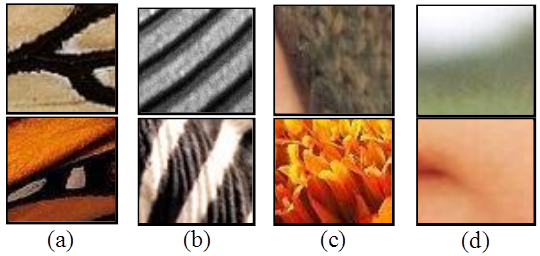
Fig.
2. Examples of image attributes. (a) Strong edges. (b) Weak edges (non-sharp
edges at the top and vertical wrinkles at the bottom). (c) Textures. (d) Smooth
regions.
Moreover, Fig. 2 and Table 3 show the attributes of individual test images, where each image is associated with one or more out of the four attributes: strong edge, weak edge, texture, and smooth region. The strong-edge attribute indicates that the edges in an image is with high contrast and sharpness, whereas the weak-edge attribute means that the edges in an image is relatively less sharp. The average preference ratios in Table 3 show that the proposed methods perform well for all attributes in general, but the performance for weak edges is not as good as that for the other attributes. Besides, since image #5 contains fewer high-frequency details, it is difficult to retrieve enough high-frequency information from blocking-artifact atoms for effective super-resolution using the proposed methods, thereby making the benefit of our method limited. These are why the subjective rating for the SR versions of image #5 upscaled by the proposed methods are lower than those of the other test images.
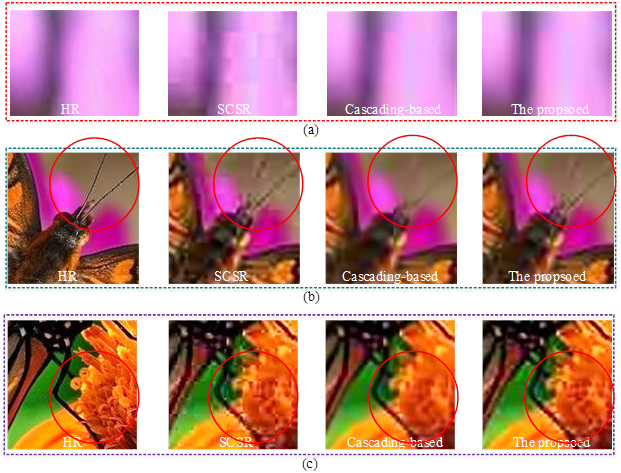
Fig.
3. SR results of some image regions:
(a) smooth region; (b) region with strong edges; and (c) region with fine
textures.
Compared to image
#5, test images #1 and #3 contain richer textures and smooth regions. Since the
blocking artifacts are relatively visible in smooth region [e.g., see Fig. 3(a)]
and fine textures contain useful high-frequency information for
super-resolution, it is easier for the subjects to visually assess the
deblocking and super-resolution performances of the compared methods for images
#1 and #3. Figs. 3(b) and 3(c) show the reconstructed images with fine details
(i.e., high-frequency components), which obviously illustrate the effectiveness
of the proposed method.
Finally, we summarize the above
analyses as follows:
- Compared to SR without deblocking
(i.e., the original SCSR and SelfSR), our methods are significantly more
effective for images with strong edges, textures, and smoothing regions.
- Compared to SR with
deblocking, our methods achieve significant visual quality improvement for
image regions with strong edges and textures. As for smooth regions, since
blocking artifacts in such regions can be effectively mitigated using the deblocking
part of the cascading-based approaches as well, our methods achieve comparable
visual quality with the cascading-based approaches.
- Compared to existing SR
methods (with or without deblocking), our methods in general achieve overall
visual quality improvement over the existing methods.